Home > Research > Education > Master thesis
How do we see exciton dynamics in antenna networks with 2D spectroscopy?
General description of the research
Title: How do we see exciton dynamics in antenna networks with 2D spectroscopy?
This master research project was done in the group of theory of condensed matter (ToCM), under supervision of Thomas La Cour Jansen, and with Remco Havenith as second examiner.
Starting date: May 2020
Presentation date: 21 July 2021
A recording of the presentation was made. This recording is available below.
In case anyone would like to use the presentation as a whole, it is shared below.

The animations I created to explain the pulse sequence in two dimensional electronic spectroscopy (2DES) are free for download, one section lower. Credit to this work is appreciated.
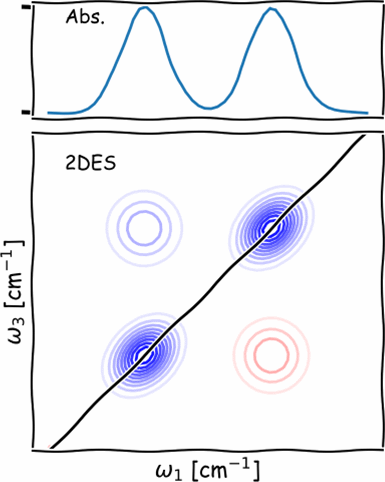
Below, I intend to explain what happens in the 3-pulse experiment, which leads to a two dimensional electronic spectrum (2DES).


The first pulse (black) indicates the start of t1, and the second pulse (red) indicates the stop of t1.
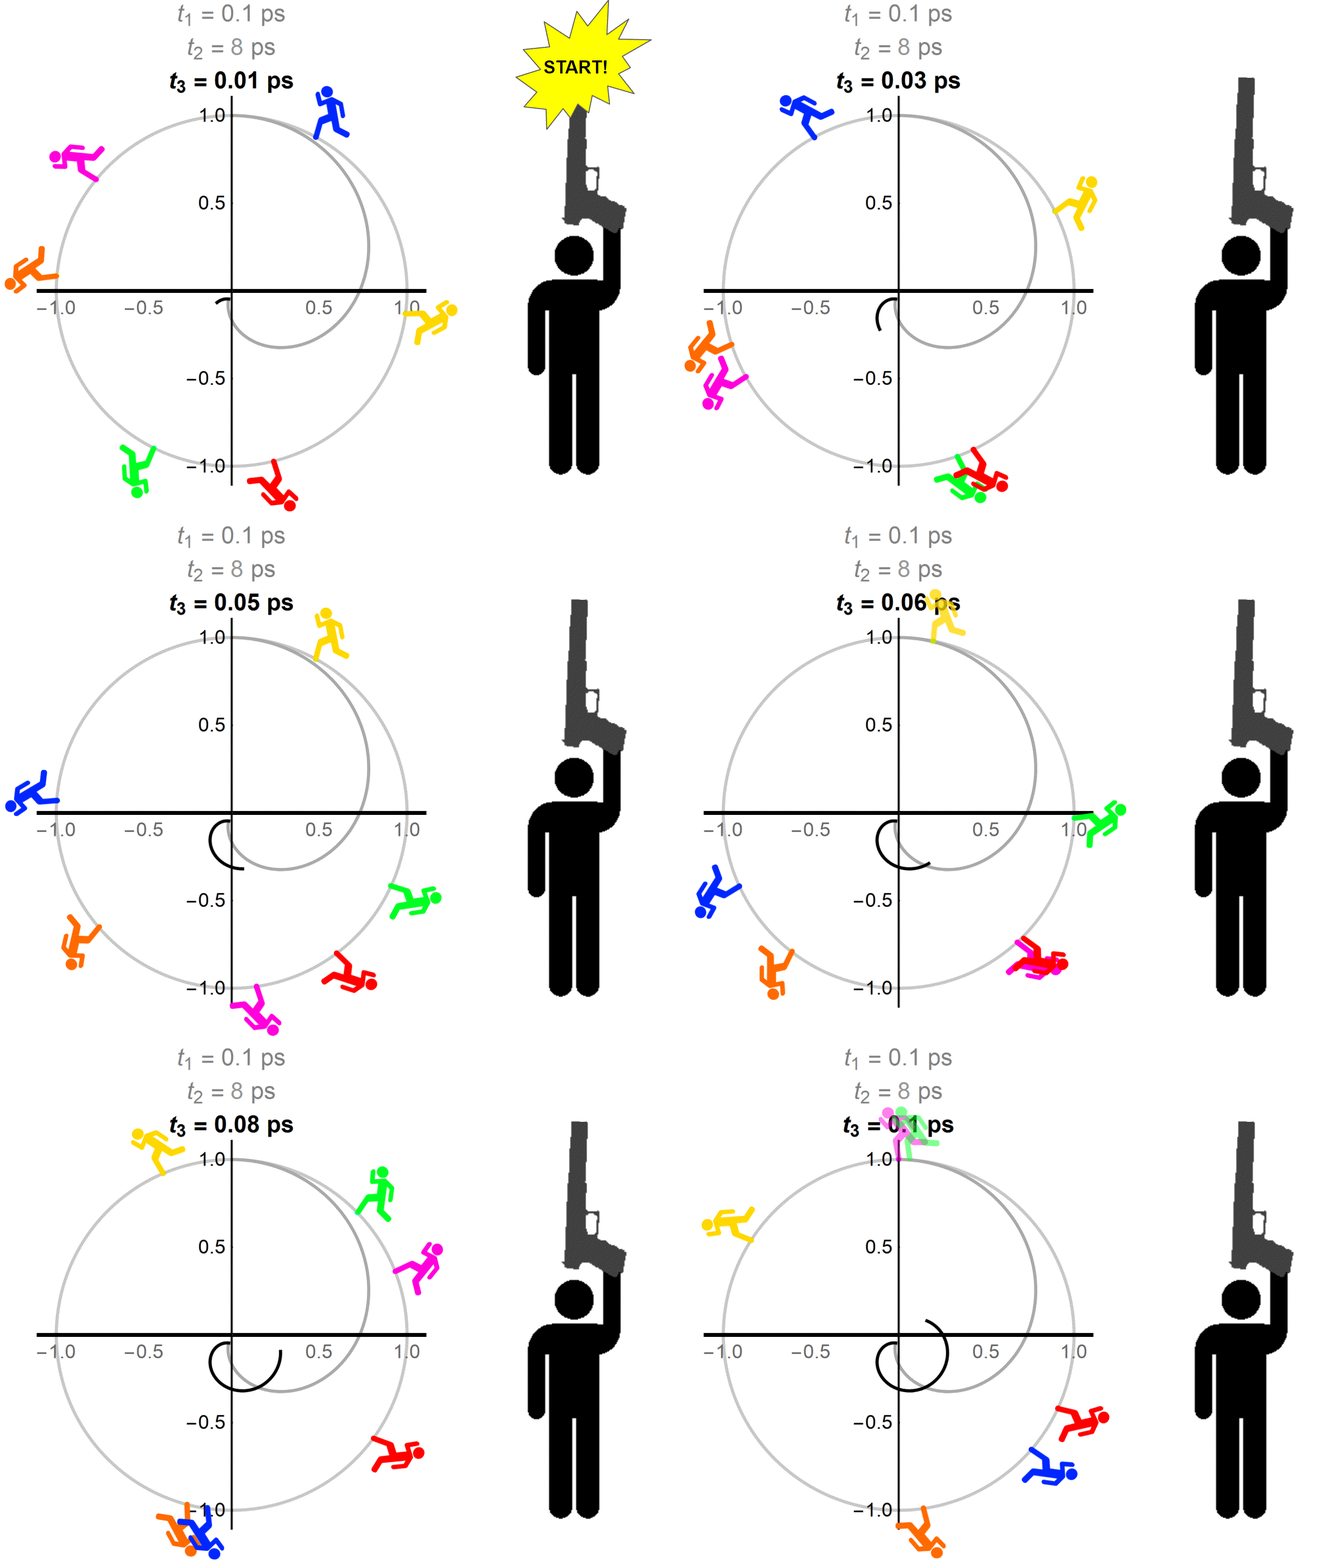
The first pulse polarizes the atoms or molecules in the medium, and the atoms or molecules start oscillating. This oscillation is represented by runners that run around in the complex plane.

The second pulse (red) indicates the start of t2, and the third pulse (blue) indicates the stop of t2.
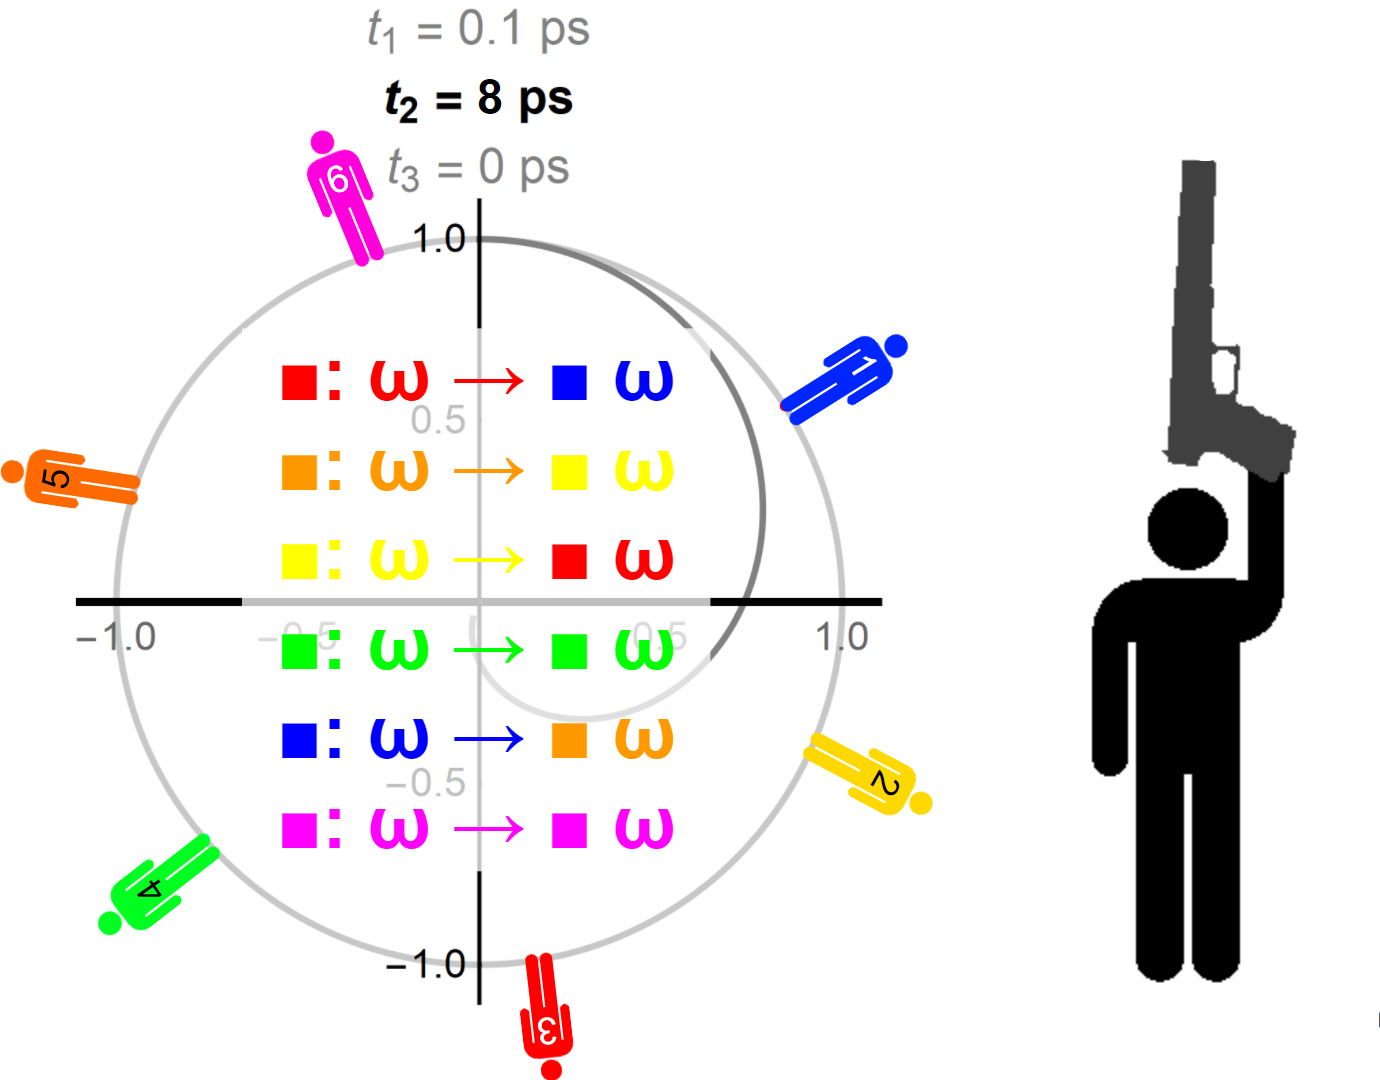
During t2, the local environment of the oscillators changes, which means that the resonant frequency of each individual oscillator needs no longer be the same as before. I chose to animate this by letting the runners change color during t2.

The third pulse (blue) stops t2. The local environment has changed, and as a result, the resonant frequencies have changed too. For this demonstration, I assumed the following pseudo-randomized frequencies after t2 (see figure below).

The third pulse (blue) indicates the start of t3, during which the oscillators start oscillating again. Now it depends in which direction the runners start running. If they start running clockwise again, then we only get more dephasing (NR*). If they now start running anticlockwise, some phase will be regenerated (R*). In the field, the these two possible outcomes are labeled Rephasing (*or R for short) and Non-Rephasing (*or NR for short). The animation below shows what happens in the rephasing case.

The regenerated polarization is an oscillating dipole. This will emit photons, and in a 3-pulse experiment, this is what we will measure. This is also the reason why the third pulse is called "The measurement-pulse", because it's the pulse we send in to obtain the measurement. The downside, however, is that the laser spectrum will overlap with the emission spectrum (see Figure below).

Figure Reprinted with permission from Reference [1]. Copyright 2013 American Chemical Society.
The laser-spectrum needs to overlap with the absorption spectrum of the species studied, because else the laser will not interact. Unfortunately, when there is little to no stokes-shift, this also means that the laser-spectrum will also overlap with the emission signal. This means that we have a lot of noise of the laser pulse, which arrives at the same time with the same frequency.
In order to over-come these complications, a fourth pulse is introduced. This technique is called Fluorescence-Detected Two Dimensional Spectroscopy (FD-2DES). Below, I will try to explain the difference between FD-2DES and 2DES a bit. The new pulse-train looks as follows:


What changes is that t3 now has both a start and a stop. The third pulse (blue) indicates the start of t3, and the fourth pulse (green) indicates the stop of t3.

The consequence is that the final situation is not an oscillating dipole, but a system with excited states. These excited states will spontaneously decay and generate photons (purple line) after some random t4 interval. We can now tweak our measurement setup such that we can measure fluorescence photons, without background noise of our laser pulse.

Unfortunately, this ultra fast spectroscopy technique is still not very well understood. This is why this master thesis was written.
References
[1] Andrew F. Fidler, Ved P. Singh, Phillip D. Long, Peter D. Dahlberg, and Gregory S. Engel. Timescales of coherent dynamics in the light-harvesting complex 2 (LH2) of rhodobacter sphaeroides. The Journal of Physical Chemistry Letters, 4(9):1404-1409, 2013. doi:10.1021/jz400438m. PMID:23878622.